




Whistleblowing benchmarks: 5 numbers worth measuring against
Reporting volume, anonymity, substantiation, closure time, and check-back rate, benchmarked across 528 organizations and 41,170 reports.

Most compliance teams know their own reporting numbers well: how many reports came in last quarter, how long cases took to close, which categories dominate. Few have a peer reference point. Without one, a reporting rate of 0.6 per 100 employees is just a number. It could mean a quiet workforce, a channel nobody knows about, or a program running exactly as it should.
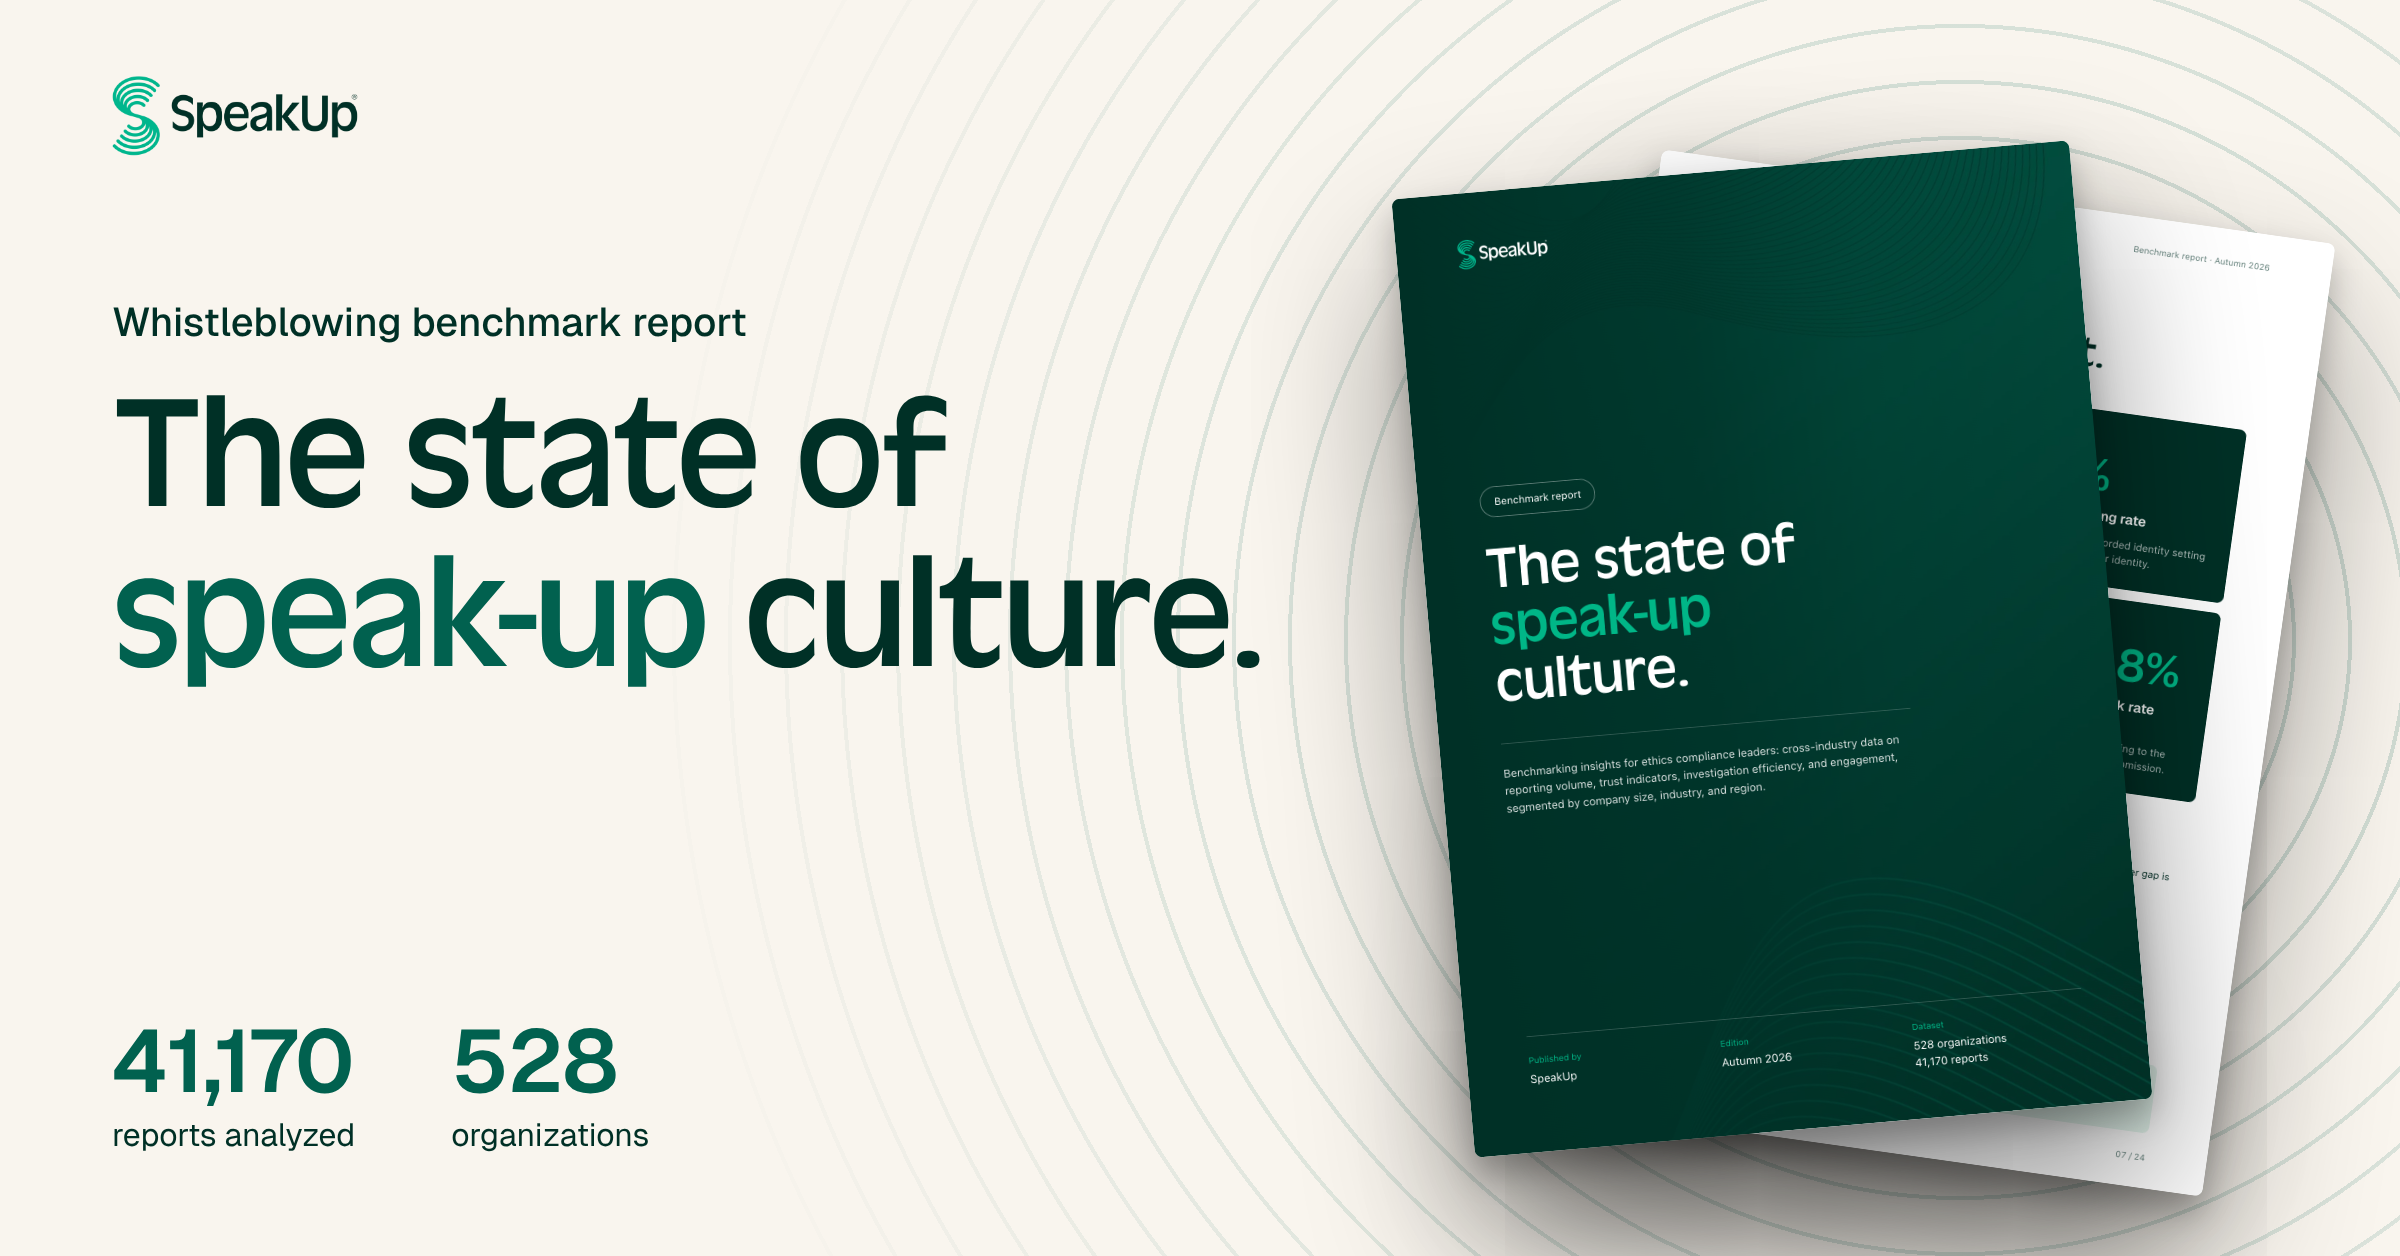
We pulled together a benchmark to close that gap. The figures below come from activity on the SpeakUp platform between July 1, 2025 and June 30, 2026: 528 organizations and 41,170 confidential reports. These are platform records, not survey responses, so they show what people actually did rather than what organizations say they do.
1. Reporting volume: 0.88 reports per 100 employees
The platform rate is 0.88 reports per 100 employees. Volume does not fall in a straight line with organization size:
- Under 1,000 employees: 2.84
- 1,000 to 5,000: 0.92
- 5,000 to 10,000: 1.18
- 10,000 or more: 0.73
Organizations under 1,000 employees report at roughly three times the platform rate. One plausible reason is distance: when employees can picture the person who will read their report, speaking up feels less like shouting into a void.
A low volume rarely means few problems. More often, employees do not know the channel exists or doubt that using it is safe. If your rate sits well below your size band, treat it as a question to investigate. We wrote more about that in not getting any misconduct reports.
2. Anonymity: 63.6% of reporters stay anonymous
Among reports with a recorded identity setting, 63.6% arrived without a name attached. The spread tells you more than the headline:
- Under 1,000 employees: 48.9% anonymous
- 5,000 to 10,000 employees: 73.7% anonymous
- Europe: 60.4% anonymous
- Latin America and Caribbean: 75.3% anonymous
Anonymity is a right, and in several jurisdictions the law protects it. A high rate is not a failure. But if your rate runs far above comparable organizations, ask what makes putting a name to a concern feel risky. Stronger anti-retaliation policies, manager training, and anonymized examples of past reports that led to positive outcomes can build the trust that lets more reporters choose to identify themselves.
3. Substantiation: 46.2% of cases with a clear outcome
Of cases that closed with a clear finding, 46.2% were substantiated. The number behind it is more telling: two in three closed cases (66.2%) end without a clear substantiated or unsubstantiated outcome.
That is a measurement problem before it is a performance problem. When most closed cases have no finding on record, you cannot show your board what the program caught, and you cannot tell weak intake from strong triage. Three fixes help: a required outcome field at closure, a shared outcome taxonomy across HR, Legal, and Compliance, and a regular review of cases closed without a finding.
4. Closure time: 41 days, with industry setting the pace
The platform median is 41 days from intake to closure. Industry matters more than headcount: medians run from 34 days in technology and software to 50 days in energy, utilities, mining, and environment. Organizations with 1,000 or more employees sit at 41 to 42 days, while those under 1,000 take 51.
Case mix drives much of the industry gap. Industrial manufacturing receives the highest share of human rights and modern slavery reports on the platform (11.6%), and those cases pull in suppliers, external counsel, and several jurisdictions. How you define “closed” matters too: if your team keeps a case open until every corrective action is complete, your closure time includes the remediation period. Compare yourself against your industry and size band, not the platform median alone.
5. Check-back rate: 45.8% of reporters come back
Almost half of reporters log back in after the organization replies, and read that response. By industry, the rate runs from 31.3% in professional and business services to 53.0% in real estate and construction.
This is the metric we find most underused. A reporter who returns is still willing to engage. A reporter who never comes back may have concluded that nothing will happen, or may not know they can return. If your check-back rate is low, start with proactive status updates, a simpler login, and closing the loop on every outcome, including dismissals.
How to use these numbers
Find your closest peer segment first: your industry, then your size band, then your region. Then compare the two or three metrics that matter most for your risk profile.
A metric above or below the platform rate is not automatically good or bad. It tells you where your program deserves a closer look.
The full report breaks each metric down by industry, company size, and region, and includes a peer comparison matrix and the methodology behind every figure. Get the benchmark report.
Frequently asked questions
What is a good whistleblowing reporting rate?
There is no universal target. The platform rate is 0.88 reports per 100 employees, but organizations under 1,000 employees report at 2.84 and those with 10,000 or more at 0.73. Compare against your own size band before you draw conclusions.
What is a check-back rate?
The share of reporters who log back in after the organization has replied, and read that reply. It shows whether a report became a two-way conversation. The platform rate is 45.8%.
Is a high anonymity rate a problem?
Not by itself. Anonymity is a reporter’s right and, in some regions, a legal expectation. A rate far above comparable organizations can point to a trust gap, especially alongside a low check-back rate.
How were these benchmarks calculated?
Each figure is a pooled rate across all reports in the period, drawn from platform records rather than self-reported data. Case closure time is the one median. We anonymize organizations, cases, and reporters before analysis, and we never use free-text content. Segments with fewer than 100 reports are excluded.