

.svg)


The data exists. Getting to it shouldn't be that hard
Most ethics and compliance teams know the data exists. The problem is everything that stands between them and using it. Scattered access, no easy way to visualize it, and a growing queue of stakeholders all asking different questions.
Sienna Insights puts you in control
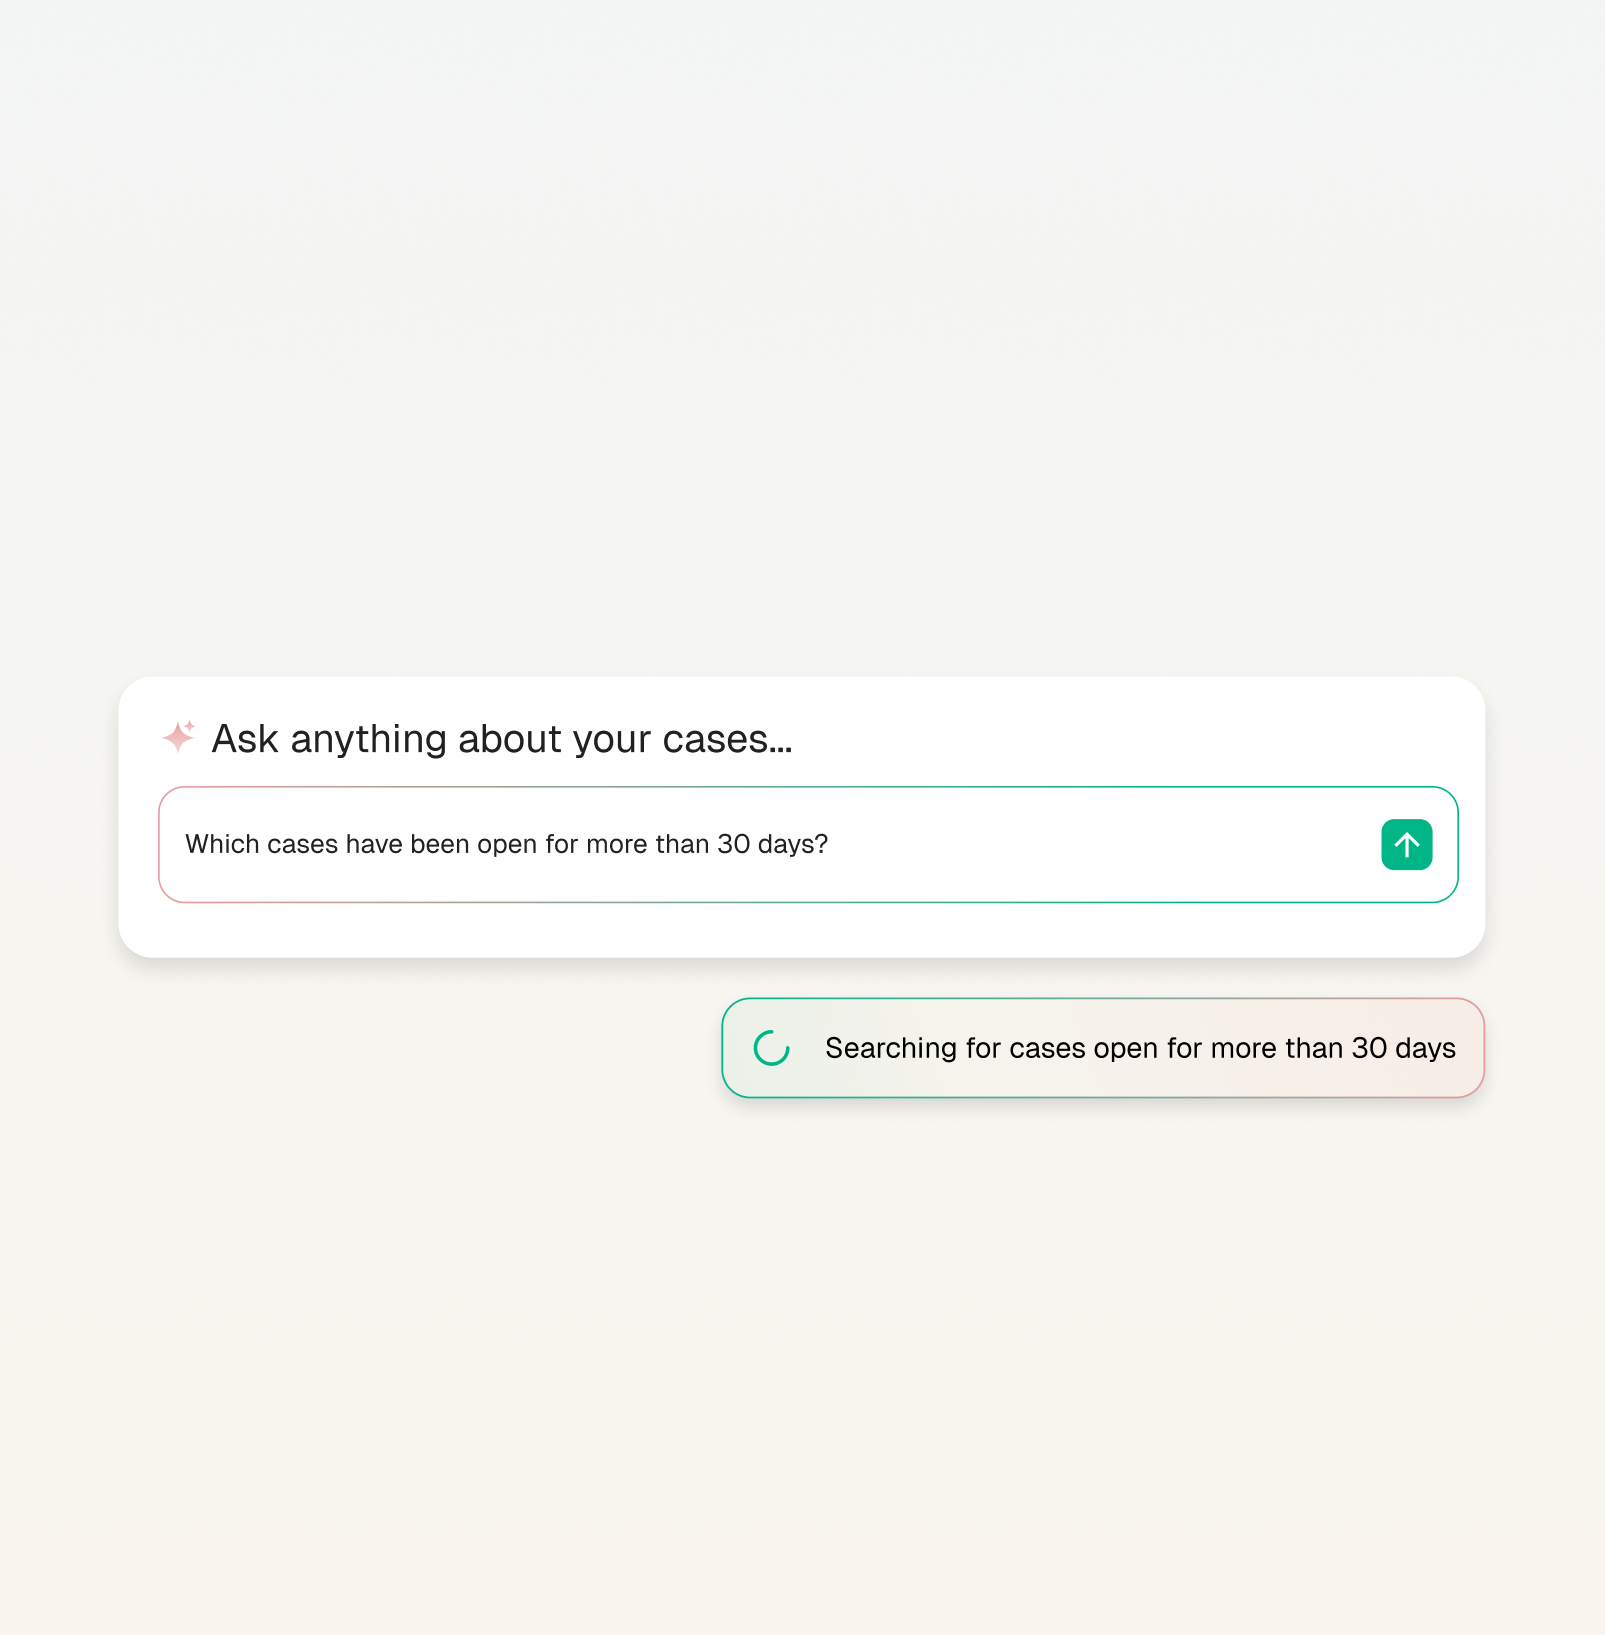
Instant answers, no digging
Ask a question in plain language and get a precise answer from your live data in seconds. AI does the filtering so you don't have to - no reports to dig through, no waiting on anyone else.
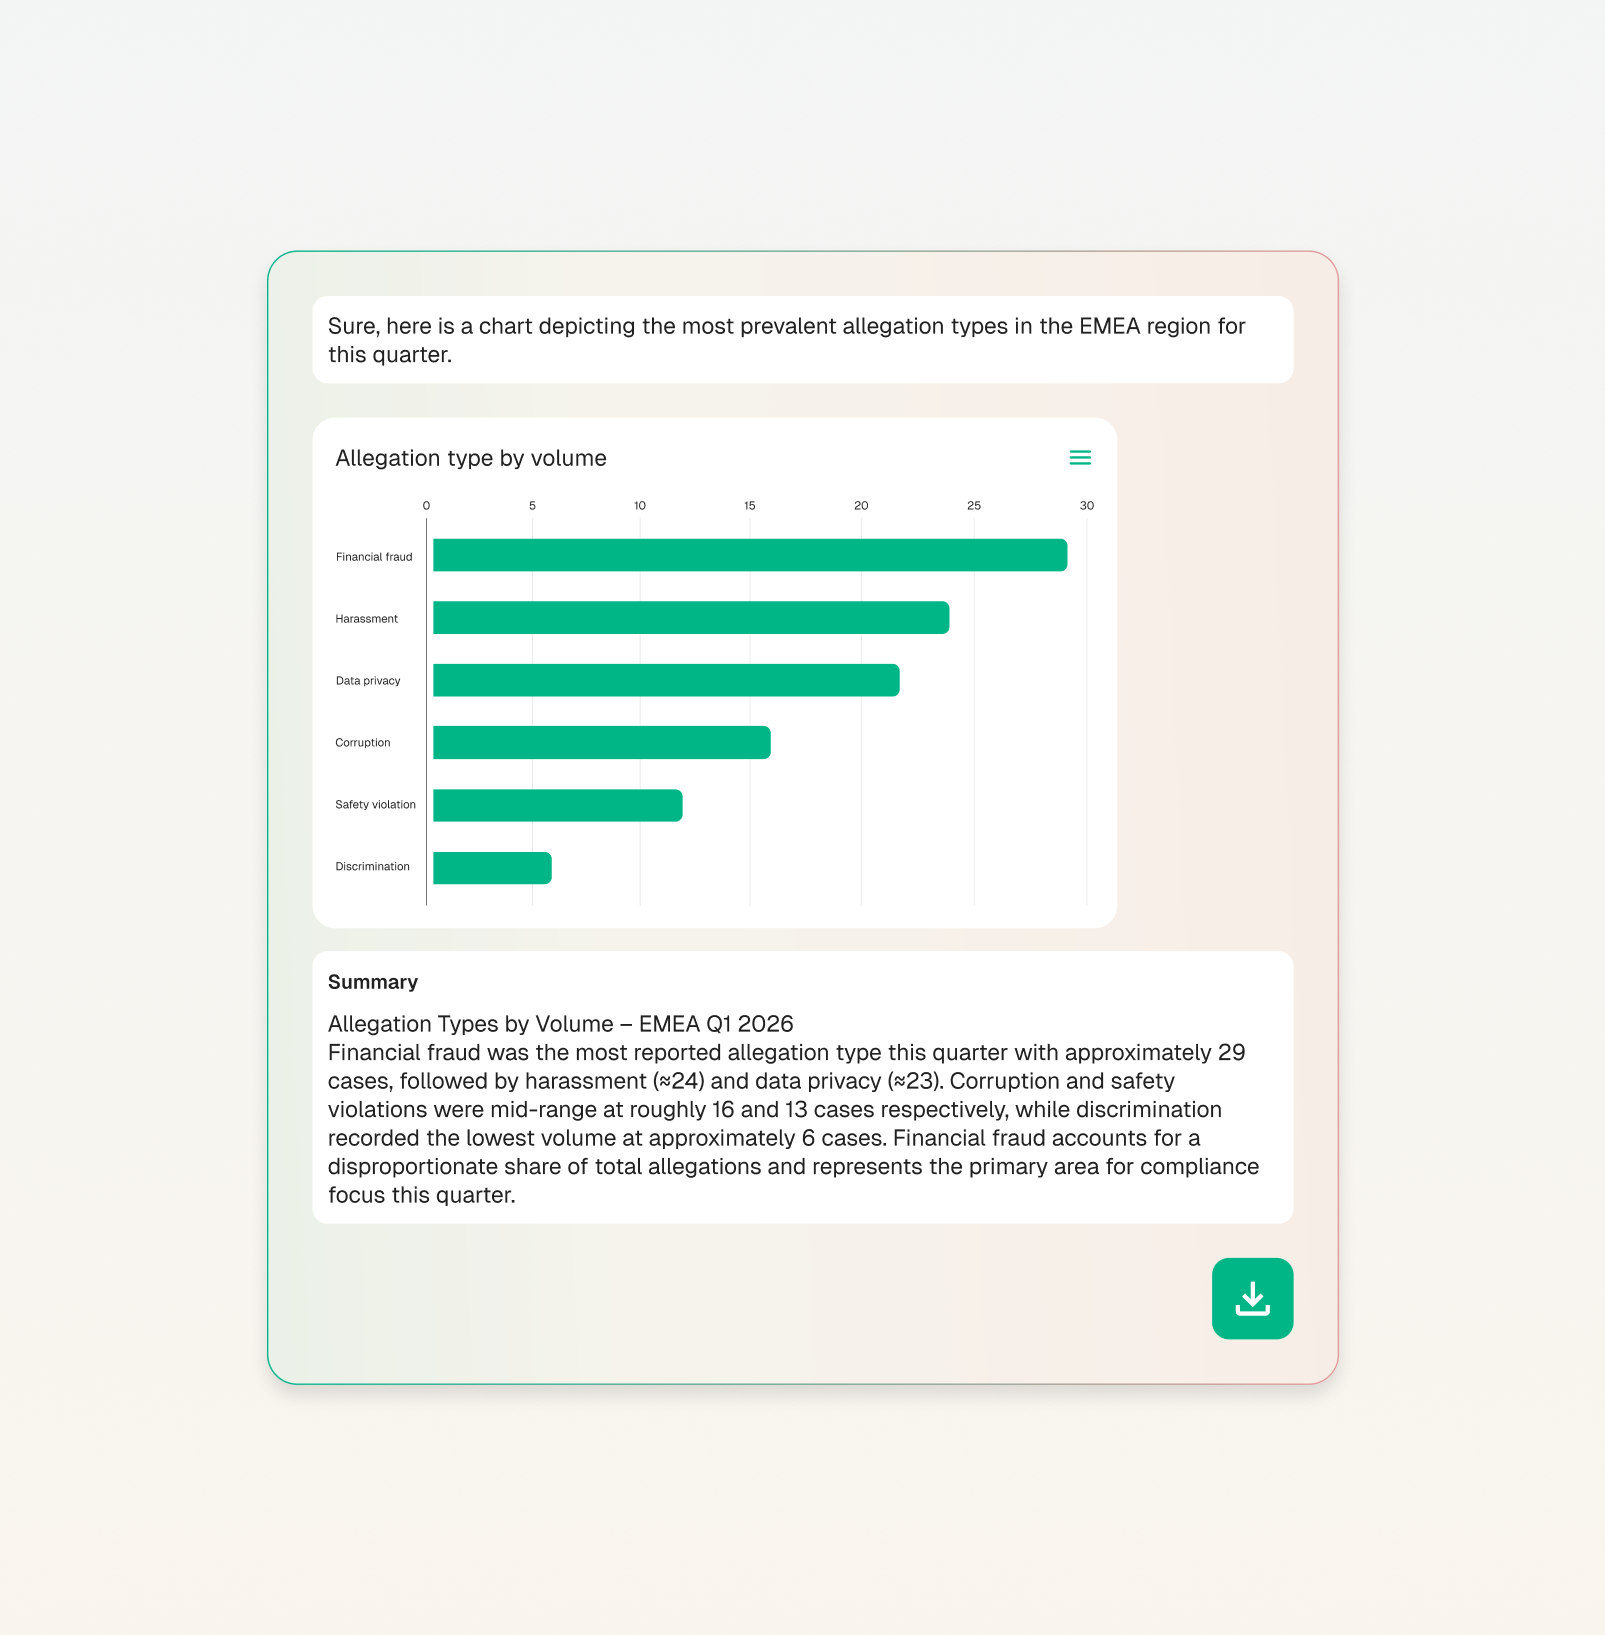
Insights that show themselves
Trends, patterns, and case status surface automatically - AI does the work of finding and formatting them so all you see is a clear visual, ready for a decision. No exports, no manual steps.

One tool, every stakeholder
Uncover the right information and view for each audience. Board, leadership: everyone gets what they need without you rebuilding it every time.
Frequently asked questions
How much does it cost?
Sienna Insights is available as a paid addition to your SpeakUp program. Pricing is tailored to your organization, so reach out and we'll put together a proposal that fits your setup.
What kind of questions can I ask?
Anything you'd normally ask a colleague or analyst. "What came in this week?" "Which topics are up in EMEA?" "How long are cases taking to close?" If the answer is in your data, Sienna will find it.
How is this different from the analytics SpeakUp already offers?
SpeakUp's existing analytics give you structured visibility into your program. Sienna Insights goes further — instead of navigating to a report, you ask a question in plain language and get an instant answer. It's faster, more flexible, and works for different stakeholders without any rebuild.
How does Sienna Insights handle data privacy and security?
Sienna Insights operates within SpeakUp's existing security framework. Your data stays within your environment - it is not used to train models or shared externally. Full details are available in our security documentation.
Is my data used to train AI models?
No. Your data is never used to train AI models - not ours, not third-party. What happens in your program stays in your program.
Can we build reports without vendor assistance?
Yes. Sienna is built directly into your SpeakUp workspace. Ask a question and get a chart, table, or summary from your live data in seconds. Your team runs its own queries without filing a request or waiting on support.
Can we create custom dashboards?
Yes. When a Sienna response includes a chart, you can save it directly to an Analytics view. Saved charts appear in your dashboards and reports, so you build up a reusable library as you go.
Can we segment by region, business unit, or case type?
Yes. Ask "Show me a breakdown by allegation type" or "Which cases are trending in EMEA?" and Sienna filters the answer from your data. Any dimension your program captures is queryable, and you can follow up with deeper questions in the same conversation.
Can we export data to Power BI or Tableau?
Yes. Every Sienna chart can be downloaded as a CSV for use in Power BI, Tableau, or any other tool, or exported as a PNG for presentations.
Can we track investigation SLAs and ageing?
Yes. Ask "Which issues have been open for more than 90 days?" or "How long are cases taking to close?" and Sienna returns the current picture from your live data. You get a precise read on case progress at any moment without building a manual report.